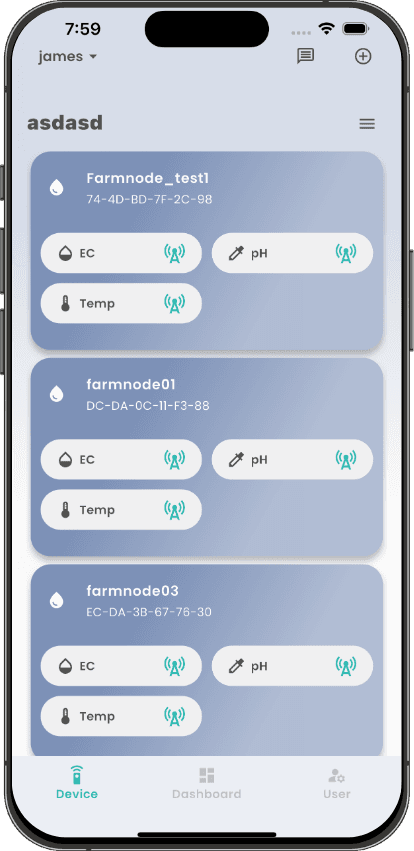
Each device is represented with a card, allowing users to quickly identify and manage their devices.
All devices shown here have been successfully added to the user's account and assigned to the current device group.
For each device, the latest EC, pH, and temperature channels are displayed in a compact status row.
The antenna icon beside each sensor shows the current communication status so users can quickly see if data is being received.
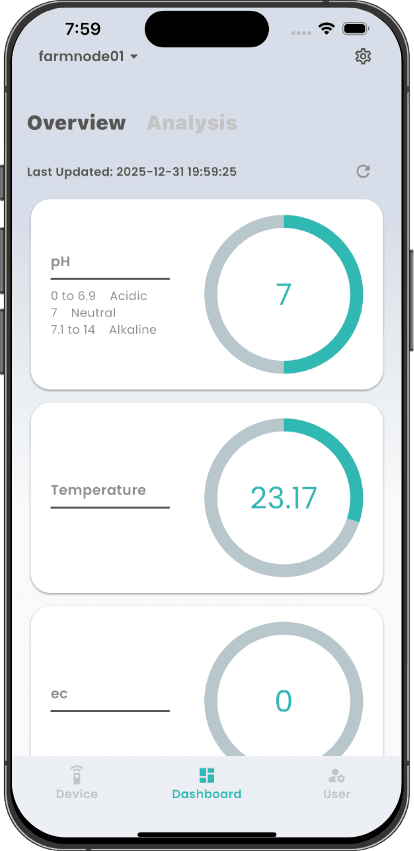
shows the current value measurements of the device
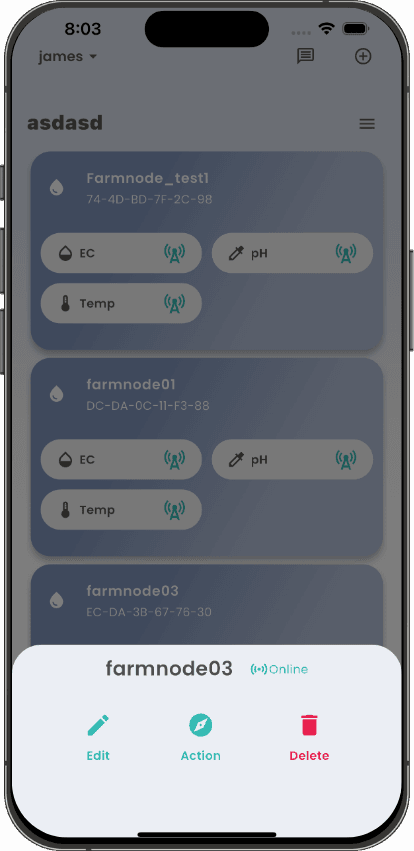
check the device status and control the device remotely
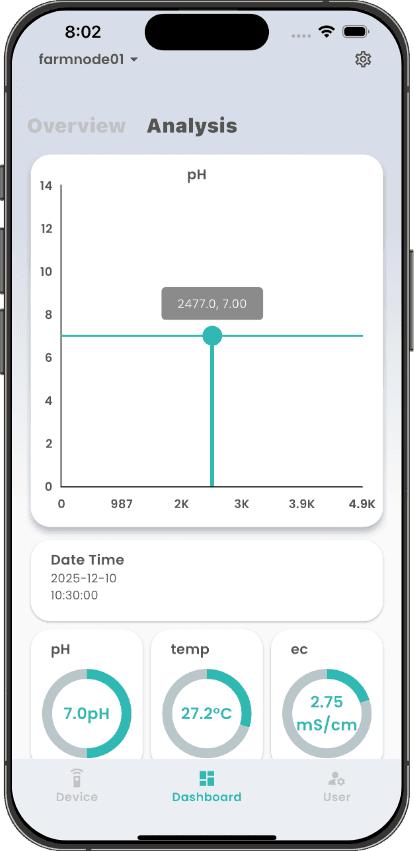
Real time data analysis and visualization